
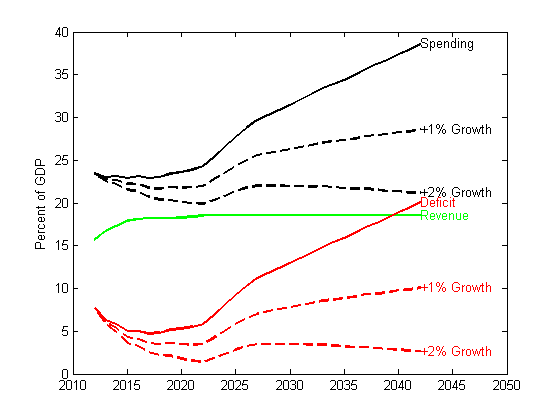
Above, I plot the CBO's long term outlook, in the alternative fiscal scenario (i.e. the one that is even faintly plausible). As you can see, though they think the deficit gets better for a bit, then the entitlements disaster is still with us.
Of course, this will not happen, the only question is what adjusts. If bond markets get a whiff that we actually will try these paths, we have a crisis on our hands.
So what can adjust? Revenue is historically about 20% of GDP no matter what tax rates are. Doubling Federal revenue, while of course states, cities and counties keep taxing us, seems like an unlikely prospect. I'm all for cutting spending, but really, cutting spending in half, and by more than 20 percentage points of GDP? Well, it's in the Ryan budget, but it's a lot. So, what else can we do?
Answer: Growth. Tax revenue equals tax rate times income, and income equals todays income times growth. Greater growth makes all the difference.
To illustrate this point, I made a simple calculation. Suppose growth is 1% and then 2% greater than the CBO projects. What effect does that have? To keep it very simple, I assume that spending stays the same, and revenue stays the same fraction of GDP. Thus, I just divide spending/GDP by a 1% and then 2% growth rate (e^(0.01 t)) and we have the new spending as a fraction of the larger GDP.
This thought sent me back to look at the CBO's economic assumptions,

Uh-oh. The CBO thinks we are going to quickly enter a period of 4% growth, go back to trend, and then start growing smartly. Tax revenue = tax rate x income, that's a lot of revenue. The CBO, the Fed, and everyone else (me too for a few years) has been forecasting this bounce back growth just around the corner for a while now. What if it doesn't happen, and 1.5% growth without catching up to trend is the new normal?
To keep it simple, I redid the above chart now just assuming 1% and 2% less growth than the CBO.

So, the real budget news that could matter has little to do with tax rates or spending. What matters most of all is whether we break out of this sclerotic growth trap.
I found this graph pretty chilling as well:

Really, what chance do you think there is that defense, nondefense discretionary and other mandatory spending will decrease form 4% of GDP to 2.5-3% of GDP in 10 years?
The net interest line is interesting. That's a huge rise. Why? Here are the other economic assumptions

You see the strong GDP growth, 4% for several years, in the top left panel. Inflation, bottom left, apparently has nothing to do with deficits, the Phillips Curve is alive and well.
But, the CBO is projecting interest rates to rise sharply in 2016, back to a low-normal 4% 3 month and 5% 5 year rate. This causes the $850 billion a year in interest costs highlighted in the previous graph, about the same numbers I was bandying about in "Monetary Policy with Large Debts" when worrying whether the Fed could actually do that to deficits.
From the deficit view, a Japanese lost decade of low interest rates would keep this from happening (or postpone it). Of course any financial event leading to higher interest rates would increase these interest payments a lot.